We provide Crypto Indicator online (apkid: io.github.novalabsandroid.cryptoindicator) in order to run this application in our online Android emulator.
Description:

Run this app named Crypto Indicator using MyAndroid.
You can do it using our Android online emulator.
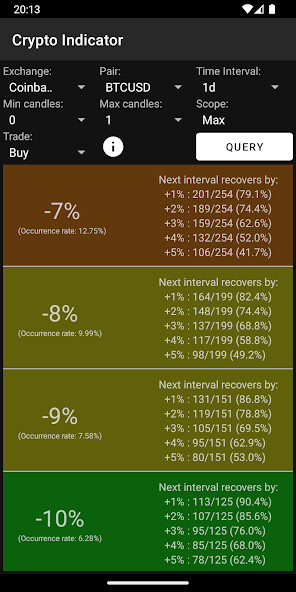
Crypto Indicator is a trading helper app that analyzes market behavior and identifies common patterns you can use to make profitable trades.
The app's algorithm is based on crypto price movements typically not being linear, often having corrections with the price moving in the opposite direction.
Each of these corrections presents a chance to buy or sell an asset for a profit margin, but it can sometimes be difficult to discern whether a particular price movement is a good trading opportunity.
That's where Crypto Indicator comes in, providing an automated analysis that highlights the optimal price movements to trade in.
How to use:
- Set the exchange and trading pair to the asset you're planning on trading, and optionally configure a custom time interval, then start a query.
- The results are shown below the configuration options.
Each row represents 1% of price movement, showing you its occurrence rate (how frequently the price drops or increases by this amount) as well as the probability of price movenment reversal in the next time interval(s).
- A successful daytrading strategy involves buying on dips that have a high probability of reversal (ideally 80% or higher) then selling at a profit when the correction occurs, or conversely, selling during an abrupt increase in price and rebuying as the price corrects back down.
Each row is also color-coded (green/yellow/orange/red), with green representing the best price movemenets to trade in, and red the worst ones.
Powered by Cryptowatch API
MyAndroid is not a downloader online for Crypto Indicator. It only allows to test online Crypto Indicator with apkid io.github.novalabsandroid.cryptoindicator. MyAndroid provides the official Google Play Store to run Crypto Indicator online.
©2024. MyAndroid. All Rights Reserved.
By OffiDocs Group OU – Registry code: 1609791 -VAT number: EE102345621.