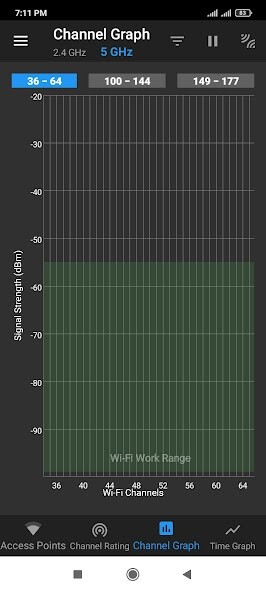
We provide WiFi Energy online (apkid: com.vrem.wifiworkzone) in order to run this application in our online Android emulator.
Description:

Run this app named WiFi Energy using MyAndroid.
You can do it using our Android online emulator.
WiFi Signal Energy Levels (signal levels) required for standard WiFi operations
App demonstrates RSSI levels (received signal strength indicator).
WiFi Signal levels are based on manufacturers access point data specifications.
Intense WiFi signals, Waste Energy, Waste Spectrum & cause Interference Issues with nearby networks.
RSSI example:
-70dBm = Signal required for Max Data Capacity.
-10dBm Signal = 1,000,000 times more energy than -70dBm.
Examples of excess energy consumption of different WiFi signal levels
RSSI -70dBm = Max Signal Required (2.4Ghz).
-60dBm = 10 times more energy.
-50dBm = 100x
-40dBm = 1,000x
-30dBm = 10,000x
-20dBm = 100,000x
-10dBm = 1,000,000x
RSSI values based Irish Primary & Secondary school APs (Fortinet 822x & Aruba 34X).
Fortinet 822x & Aruba 34x have the following RSSI data specifications:
2.4Ghz
802.11b =-91dBm & -97dBm (lowest signal)
802.11n = -71dBm (HT40) (strongest signal)
5Ghz
802.11a =-77dBm & -74dBm
802.11n =-70dBm & -68dBm (5Ghz, HT40)
802.11ac = -55dBm (5Ghz, VHT 160Mhz)
MyAndroid is not a downloader online for WiFi Energy. It only allows to test online WiFi Energy with apkid com.vrem.wifiworkzone. MyAndroid provides the official Google Play Store to run WiFi Energy online.
©2024. MyAndroid. All Rights Reserved.
By OffiDocs Group OU – Registry code: 1609791 -VAT number: EE102345621.