We provide Mobility Vision+ online (apkid: com.mobilityvisionplus.movi) in order to run this application in our online Android emulator.
Description:

Run this app named Mobility Vision+ using MyAndroid.
You can do it using our Android online emulator.
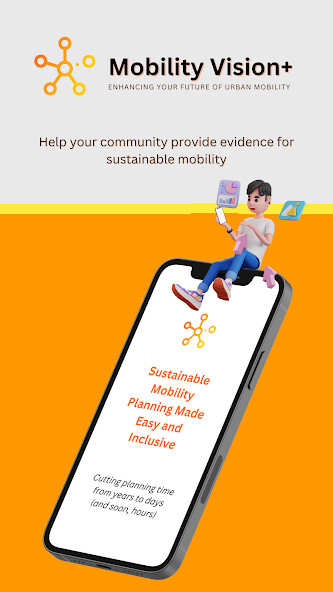
Are you sick of poor or slow transport planning? Contributing to sustainable mobility planning has never been this easy as MobilityVision+ (MoVi+).
Key features:
-Upload a photo to rate infrastructure in your city.
You can also rate other reports by the community.
-Report traffic violations that hamper deployment of sustainable mobility.
-Report on your public transport context.
-Upload short videos so we can capture modal counts.
-Explore the data gathered by the community on the View Map tab.
-For higher tier plans, see the details of traffic violation reports.
MoblityVision+ (MoVi+) is a map-based urban mobility planning app that helps cities, especially in emerging markets to identify and solve their traffic problems.
MoVi+ is an end-to-end sustainable mobility planning solution that gamifies data collection and interactions with the community, eliminates manual counts using computer vision, automates mobility analytics, and creates a decision recommender system.
MoVi+ gives the users a detailed picture of the mobility situation in the city and enables pre- and post-implementation evaluation of measures.
Additionally, the app also allows reporting of illegal parking and obstruction violations and soon other traffic violations.
Full list of features are below.
1.) "Profile" Screen:
-Upload your profile pic
-Indicate a displayed username
-Create your mobility profile, so we can understand your needs in relation to the aggregated statistics of reports
2.) "Add Data" Screen:
-Upload street infrastructure image
-Report traffic violation
-Upload count video
-Report public transport context
-Save pin for later
3.) View Map Screen:
-Explore the data gathered by the community
-Users can rate all photos uploaded by the community
-You can edit your rating of images and caption (for those you uploaded) on the screen.
-Google Maps real-time traffic layer is also activated now in the background
-A time-series map is now implemented as an example in map tile in Pasig City to show changes in modal share over time in a certain area
-Violations are displayed only to high tier users
-Videos do not have images
-Black pie chart (Video still being processed) does not show anything
MyAndroid is not a downloader online for Mobility Vision+. It only allows to test online Mobility Vision+ with apkid com.mobilityvisionplus.movi. MyAndroid provides the official Google Play Store to run Mobility Vision+ online.
©2024. MyAndroid. All Rights Reserved.
By OffiDocs Group OU – Registry code: 1609791 -VAT number: EE102345621.