We provide Aira10.0.22-Esp online (apkid: com.appsheet.whitelabel.guid.832440c6.af46.468d.9b1a.701523178a30) in order to run this application in our online Android emulator.
Description:

Run this app named Aira10.0.22-Esp using MyAndroid.
You can do it using our Android online emulator.
Upon entering the App, you will see the main features in the bottom bar.
There are 3 tabs:
1.
In the Assessment tab you can view and filter the new contacts by clicking on the column name (name, risk, risk factor, etc.).
By default, contacts are sorted by date.
For a detailed view, click on the contact you want to see.
2.
The Management tab is for managing patients based on their risk, assigning an assistant, checking status, and making notes.
3.
In the Follow-up view, you can see two tabs: the Operated tab to add a complication to a treated patient; and the Follow-ups tab where you can check status and see reminders when to call patients (5 and 45 days after contact).
On the top bar, from left to right, you'll find a menu and tool icons (a search magnifying glass, a pencil, a checkbox, and a curved arrow).
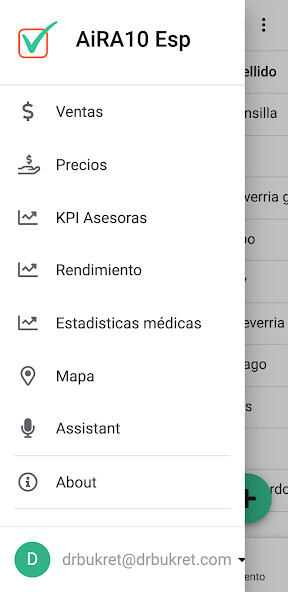
Secondary menu functions.
In the top left corner menu (3 horizontal lines) next to the Aira10 logo, find other interactive features.
1.
Sales This view shows sales metrics.
You can add and edit patients, sale price and cost per treatment.
The application will calculate the contribution margin and the percentage of contribution margin or gross profit in each treatment.
2.
Prices: in this view you can configure the treatments you perform, the base price, the discount applied, the percentage assigned to commercialization (MKT) and the risk-adjusted Beta for each procedure (eg the Beta 2 value doubles the importance of risk , while 0 reduces it).
3.
The Map view is used to know where your patients are coming from and send them directions to your practice.
4.
KPI Advisors: You will be able to see production metrics of your advisors (A1, A2, A3).
5.
Performance In the Production tab, interact with graphical metrics to help you make business decisions.
The Sales chart shows annual sales.
The Risk Adjusted Price (RAP) represents the average of historical prices for all procedures.
6.
Medical statistics: See the most important performance metrics such as the number of surgeries per month, complications and the frequency in each risk group.
7.
Assistant: Click the microphone icon to activate a voice command to name the patient you are looking for, for a quick search in your database.
Tool icons in the top bar
1.
Search Magnifier: Type a name or any data for a quick search.
2.
Pen Click and edit the available patient data.
Please note that not all columns are editable.
3.
Checkbox: This allows you to delete data (not recommended).
4.
Curved Arrow - Click to update all data when you need it and after editing.
MyAndroid is not a downloader online for Aira10.0.22-Esp. It only allows to test online Aira10.0.22-Esp with apkid com.appsheet.whitelabel.guid.832440c6.af46.468d.9b1a.701523178a30. MyAndroid provides the official Google Play Store to run Aira10.0.22-Esp online.
©2024. MyAndroid. All Rights Reserved.
By OffiDocs Group OU – Registry code: 1609791 -VAT number: EE102345621.